
Page 30 - Condensed Interim Financial Statements - for the nine months ended March 31, 2024
P. 30
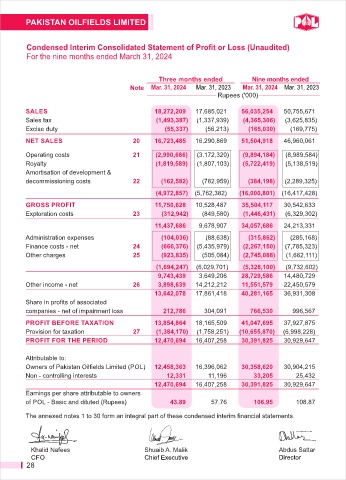
Condensed Interim Consolidated Statement of Profit or Loss (Unaudited)
        For the nine months ended March 31, 2024


                                            Three months ended       Nine months ended

                                    Note  Mar. 31, 2024  Mar. 31, 2023  Mar. 31, 2024   Mar. 31, 2023
                                                            Rupees ('000)
        SALES                              18,272,209    17,685,021     56,035,254    50,755,671
        Sales tax                           (1,493,387)    (1,337,939)    (4,365,306)    (3,625,835)
        Excise duty                           (55,337)    (56,213)    (165,030)    (169,775)
        NET SALES                    20    16,723,485    16,290,869     51,504,918    46,960,061

        Operating costs              21     (2,990,686)    (3,172,320)    (9,894,184)    (8,989,584)
        Royalty                             (1,819,589)    (1,807,103)    (5,722,419)    (5,138,519)
        Amortisation of development &
        decommissioning costs        22      (162,582)    (782,959)    (384,198)    (2,289,325)
                                            (4,972,857)    (5,762,382)    (16,000,801)    (16,417,428)
        GROSS PROFIT                       11,750,628    10,528,487     35,504,117    30,542,633
        Exploration costs            23      (312,942)    (849,580)    (1,446,431)    (6,329,302)
                                           11,437,686     9,678,907     34,057,686     24,213,331
        Administration expenses              (104,036)    (88,638)    (315,862)    (285,168)
        Finance costs - net          24      (666,376)    (5,435,979)    (2,267,150)    (7,785,323)
        Other charges                25      (923,835)    (505,084)    (2,745,088)    (1,662,111)
                                            (1,694,247)    (6,029,701)    (5,328,100)    (9,732,602)
                                            9,743,439     3,649,206     28,729,586     14,480,729
        Other income - net           26     3,898,639     14,212,212     11,551,579     22,450,579
                                           13,642,078     17,861,418     40,281,165     36,931,308
        Share in profits of associated
        companies - net of impairment loss       212,786     304,091     766,530     996,567
        PROFIT BEFORE TAXATION             13,854,864    18,165,509     41,047,695    37,927,875
        Provision for taxation       27     (1,384,170)    (1,758,251)    (10,655,870)    (6,998,228)
        PROFIT FOR THE PERIOD              12,470,694    16,407,258     30,391,825    30,929,647

        Attributable to:
        Owners of Pakistan Oilfields Limited (POL)   12,458,363     16,396,062     30,358,620     30,904,215
        Non - controlling interests            12,331     11,196      33,205      25,432
                                           12,470,694     16,407,258     30,391,825     30,929,647
        Earnings per share attributable to owners
        of POL - Basic and diluted (Rupees)       43.89     57.76     106.95      108.87

        The annexed notes 1 to 30 form an integral part of these condensed interim financial statements.


         Khalid Nafees                  Shuaib A. Malik                     Abdus Sattar
         CFO                            Chief Executive                     Director
        28