Page 4 - Pakistan Oilfield Limited - Annual Report 2022
P. 4

2
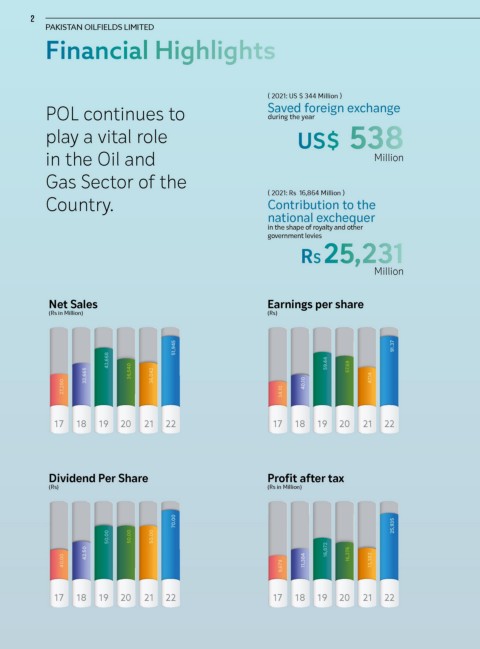
             PAKISTAN OILFIELDS LIMITED
             Financial Highlights


                                                                     ( 2021: US $ 344 Million )
             POL continues to                                        Saved foreign exchange
                                                                     during the year
             play a vital role                                               US$  538

             in the Oil and                                                                     Million


             Gas Sector of the

             Country.                                                ( 2021: Rs  16,864 Million )
                                                                     Contribution to the
                                                                     national exchequer
                                                                     in the shape of royalty and other
                                                                     government levies
                                                                              RS 25,231


                                                                                                Million


                                                                     E
             Net SalesNet Sales                           Earnings per shares per share
                                                                              g
                                                                       arnin
             (Rs in Million)  (Rs in Million)             (Rs)       (Rs)

                                              51,945     51,945                            91.37     91.37
                              43,668    43,668                            59.44   57.69  59.44   57.69

                        32,665     32,665   36,540  36,042   36,540  36,042          47.14      47.14
                  27,280     27,280                           34.10  40.10  34.10  40.10


                                                                       19
                                                                                   21 20
                                                                             20
                                20
                          19
               17   18    17   18    19    22    21   22    17   18    17   18    19    22    21   22
                                      21 20
                                                                        o
                                                                     Pr
                        Divid
                                  d P
             Dividend Per Shareer Share                   Prot after tax t after tax
                               en
             (Rs)       (Rs)                              (Rs in Million)  (Rs in Million)
                                              70.00      70.00                              25,935    25,935

                             50.00  50.00  50.00  50.00  50.00  50.00
                       42.50      42.50                                   16,872   16,376  16,872   16,376
                 40.00      40.00                              9,679   11,384   9,679   11,384   13,382   13,382


                          19
                                                                                   21 20
                                20
                                      21 20
                                                                       19
                                                                             20
               17   18    17   18    19    22    21   22    17   18    17   18    19    22    21   22
   1   2   3   4   5   6   7   8   9